Introduction: Reverse Phase Protein Arrays for Cell Signaling
Reverse Phase Protein Arrays (RPPAs) are increasingly used to study cell signaling as they are highly multiplexed and allow precise quantification of protein of interests in biological samples. Such arrays promote automation, simplified work flow, and preserve sample. One of the principal challenges faced by RPPAs is to find the best combination of an array surface that will support high binding levels of viable protein probes, and a detection method that will provide high sensitivity and dynamic range, especially as lysates are complex samples.
Fluorescence detection provides greater sensitivity and dynamic range, but is severely limited for use with nitrocellulose arrays because nitrocellulose has strong auto-fluorescence in the classic 532nm or 635nm wavelengths. A solution to this problem is to scan in the infrared wavelengths which allows diminishing background noise.
With the InnoScan 710-IR microarray scanner it is now possible to combine infrared detection with high sensitivity and quality images. Here we prove that the InnoScan 710-IR improves the detected signal by a factor of up to 2.7 especially for low concentrations of arrayed cell lysates and extends the dynamic range of detection compared to the existing infrared scanner.
Methods
RPPAs: Array probes consisted of cell lysates from RVH-421 human melanoma cells treated with different concentrations of PLX4032 as inhibitor of the BRAF kinase. Cells were incubated with PLX4032 for 1, 5, 10 or 24 hours. Cell lysates were printed on glass slides covered with nitrocellulose pads (Grace Biolabs, Bend, Oregon).
Protein detection: pS6, pERK and beta-actin were detected in the arrayed cell lysates. pS6 was detected using a primary rabbit monoclonal antibody (CST, cat #4858) and a secondary IR-labeled antibody (DyLight 800). pERK was detected using a primary rabbit monoclonal antibody (CST, cat # 4370) and a secondary IR-labeled antibody (DyLight 800). Beta-actin was detected using a primary mouse anti beta-actin antibody (Sigma, cat # A1978) and a secondary IR-labeled antibody (DyLight 680).
Arrays scanning: Slides were both scanned with the competitor scanner and the InnoScan 710-IR from Innopsys (Carbonne, France). Competitor scanner parameters: Scan resolution 21µm/pixel; 700nm wavelength for beta-actin and 800nm wavelength for pS6 and pERK detection. InnoScan 710-IR microarray scanner parameters: Scan resolution 10µm/pixel; 670nm wavelength detection for beta-actin and 785nm wavelength detection for pS6 and pERK detection.
Results and Discussion
The aim of this study was to compare the performance of the InnoScan 710-IR to its main competitor infrared scanner. We have shown that the InnoScan 710-IR improves the signal to noise ratio by a factor of up to 2.7 and extends the dynamic range compared to its competitor.
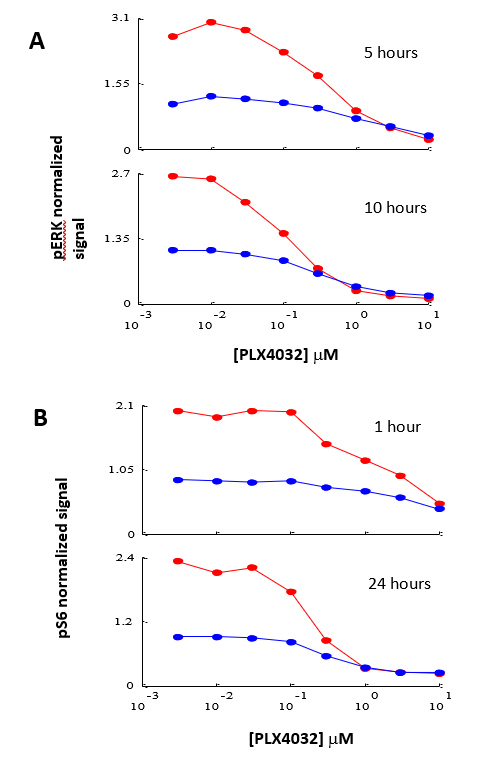
Figure 1 shows the normalized signal of pERK (Panel A) and pS6 (Panel B) in cells incubated with different concentrations of PLX4032. Using the InnoScan 710-IR scanner, the normalized signal of pERK in lysates of cells incubated for 5 hours was increased by a factor comprised between 1.5 and 1.9 for concentrations of PLX4032 comprised between 0.005 and 0.5µM, respectively. The normalized signal is similar for higher concentrations. In the same way, the scans of lysate arrays of cells incubated for 10 hours reveal that the increase in the normalized signal is comprised between a factor 1.45 and 2.7 for concentrations of PLX4032 comprised between 0.005 and 0.1µM, respectively. The normalized signal is similar for higher concentrations.
Similar results were observed for the pS6 signals (Figure 1-B). The normalized signal of pS6 in lysates of cells incubated for 1 hour is increased by a factor comprised between 1.55 and 2.1 for concentrations of PLX 4032 comprised between 0.005 and 5µM, respectively. Regarding scans of lysate arrays of cells incubated for 24 hours, they show that the normalized signal of pS6 is increased using the InnoScan 710-IRscannerbyafactorcomprised between 1.33 and 2.67 for concentrations of PLX4032 comprised between 0.005 and 0.5µM, respectively. The normalized signal is similarfor higher concentrations.
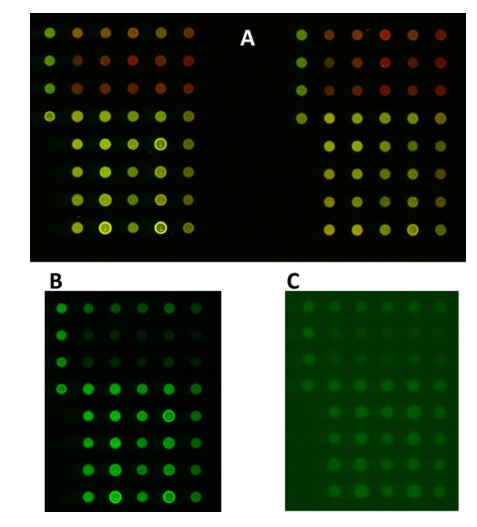
These differences in signals can be explained by the scanner specifications. The InnoScan 710-IR microarray scanner has a high resolution with up to 3µm per pixel (Figure 2). The combination of an optimized optical system (wide numerical aperture of the main lens, reduced spectral band of detection, numeric PMT) with a real- time autofocus system allows gathering a maximum of fluorescence coming from the signal of interest while diminishing the background noise.
This comparison was carried out on RPPAs. However it can be assumed that all types of protein arrays conducted on nitrocellulose slides will see their results improved when scanned the Innoscan 710-IR. Indeed the background noise is directly linked to the nitrocellulose itself and not its association to a specific probe such as cell lysate.
Figure 1: pERK and pS6 expression in RVH-421 human melanoma cells treated with PLX4032. Lysate arrays for pERK, pS6 were scanned using either the InnoScan 710-IR scanner (red lines) or the competitor infrared scanner (blue lines). Signals were normalized to the corresponding beta-actin signal. (A) pERK normalized signals of cells incubated for 5 hours and 10 hours with PLX4032. (B) pS6 normalizedsignals of cells after 1 hour and 24 hours of incubation with PLX4032.
Figure 2: Representative RPPA images. A: Ratio image of a lysate array scanned with the InnoScan 710-IR scanner; pERK was detected using a primary rabbit monocolonal antibody and a secondary Dylight 800- labeled antibody (in green); beta-actin was then detected using a primary mouse anti-beta-actin antibody and a Dylight 680-labeled antibody (in red). B: InnoScan 710-IR scan image for pERK detection (scan resolution 10µm/pixel). C: Competitor scan image for pERK detection (scan resolution 21µm/pixel).
Conclusions
RPPAs and more generally protein arrays conducted on nitrocellulose slides provide better results due to the advantages of nitrocellulose. Fluorescence analysis of nitrocellulose arrays in the visible light range has limited sensitivity and dynamic range because the high auto-fluorescence of nitrocellulose membranes creates high background levels. Scanning in Infrared dramatically reduces the inherent background from the nitrocellulose. In comparison to the competitor scanner, the InnoScan 710-IR scanner significantly improves the performance of assays on nitrocellulose slides because it is more sensitive and has a wider signal range. Thanks to a real-time autofocus system, high resolution (up to 3µm per pixel) and optimized optical flow, the InnoScan 710-IR provides high sensitivity and precise data for optimized results.