Reverse Phase Protein Arrays (RPPAs) are a specific type of protein arrays consisting of printed cell lysates useful for cell signaling and biomarker analysis. RPPAs are mainly built on nitrocellulose film slides as they have high binding capacity and viability for native proteins. Until now, RPPA assays with fluorescence detection were limited in sensitivity by high intrinsic background fluorescence normally produced by the nitrocellulose, however, it is now possible to increase the Signal to Noise Ratio using Near Infrared (NIR) detection with the InnoScan 710-IR scanner. Results show an increase up to 3 fold in signal to noise ratio when compared with traditional fluorescence scanning, mainly due to lower intrinsic background fluorescence in the NIR.
Introduction
RPPAs are protein arrays which consist of samples such as cell lysates or plasma which are arrayed and tested by using labeled antibodies against the protein of interest. They thus allow the evaluation of the level of expression in proteins of interest. RPPAs are increasingly used to study cell signaling1,2 as they are highly multiplexed and allow precise quantification of proteins of interest in biological samples. RPPAs are also powerful tools for biomarker discovery and are ultimately useful in translational medicine and clinical research3 as they can be used for disease biomarker validation and disease stratification.
One of the principal challenges faced by RPPAs is being able to find the best array surface that will support high binding levels of viable protein probes. Advances in surface chemistry approaches have led to the development of different supports that fit the requirements for protein stability especially nitrocellulosesupports such as ONCYTE® and PATH® products developed by Grace Bio-Labs Inc.
The ONCYTE® product is a three dimensional microporous film which is cast on a variety of solid surfaces (vis. Glass, plastic) and is comprised of a combination of nitrocellulose polymer and proprietary chemistry. Nitrocellulose supports provide binding affinity, binding capacity and preservation of native bioactivities thanks to the binding of biomolecules by a combination of weak intermolecular forces4. In addition, porous nitrocellulose films embrace the stereochemical requirements for effective capture of proteins. The 3D character of films also increases surface area of binding. Despite all these advantages, signal to noise on nitrocellulose can be limited due to high fluorescence background when being read with classical microarray scanner wavelengths. Scanning nitrocellulose slides at near-infrared (NIR) wavelengths can improve SNR values by decreasing nitrocellulose autofluorescence. Innopsys has developed an IR scanner dedicated to nitrocellulose-based protein arrays. Here we show that by combining Grace Bio-Labs nitrocellulose coated slides with near- infrared (NIR) detection of the InnoScan 710-IR, Signal to Noise values increase. The InnoScan 710-IR scanner dramatically decreases background issues given by nitrocellulose and therefore highly improves sensitivity for RPPAs and more generally protein arrays.
Methods
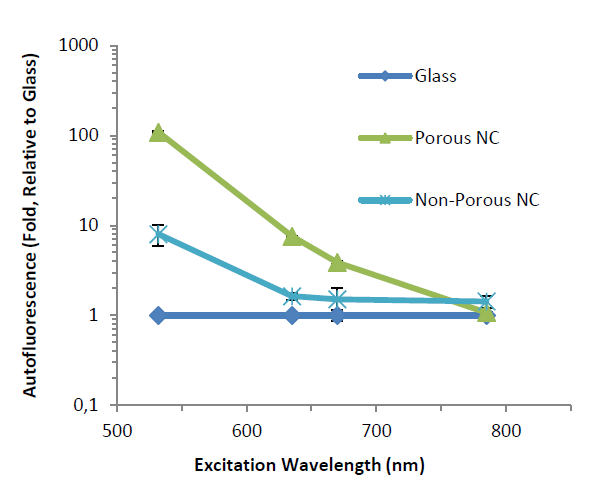
Slide surface autofluorescence: Porous and non-porous nitrocellulose slides were compared to glass slides. Blank slides of all types were directly scanned at 532, 635, 670 and 785nm and fluorescence intensities were measured.
RPPA SNR assay: In the RPPA experiment, treated- and non- treated A 431 Cell lysates were arrayed on ONCYTE® SuperNOVA Film-Slides (Grace Bio-Labs Inc) and assayed with an anti-EGFR primary antibody. Secondary antibodies were labeled with Alexa647 for detection in the visible wavelength range, IRDye680 for detection at 670nm and IRDye800 for detection at 785nm. RPPAs were scanned at 635nm and 10µm/pixel for visible wavelength detection with a competitor scanner and at 670nm and 785nm at 10µm/pixel for the infrared range with the InnoScan 710-IR microarray scanner. Scanner settings were chosen to yield comparable assay signal for all scanner/fluor combinations.
Results
When comparing fluorescence signals with the different types of slides tested, it was shown that scanning in NIR results in lower background fluorescence from nitrocellulose slides. This was especially true for porous nitrocellulose, which saw a 10 fold decrease in background signal at 785nm (Figure 1), thus reaching the same level of fluorescence as a blank glass slide.
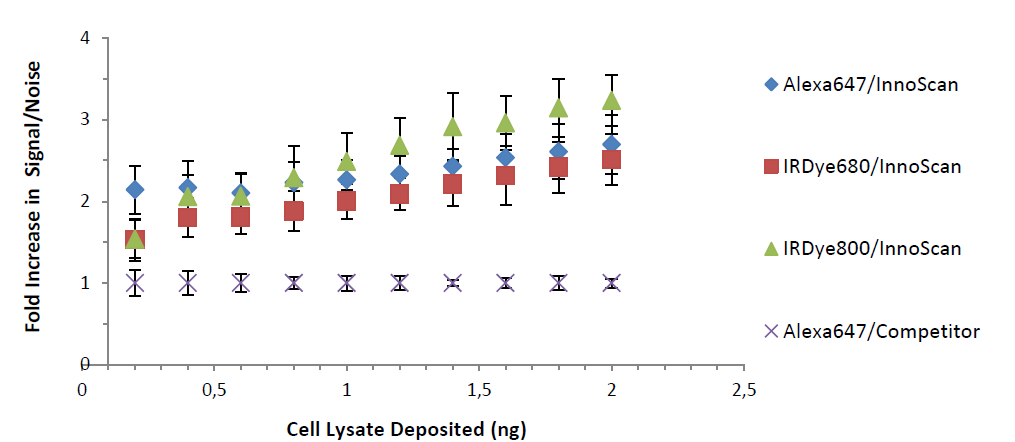
Figure 2 shows the Signal to Noise ratio of RPPA assays. Infrared detection leads to an increased SNR of 2 to 3 fold when compared to visible wavelength detection. The best SNR is obtained when scanning at 785nm.
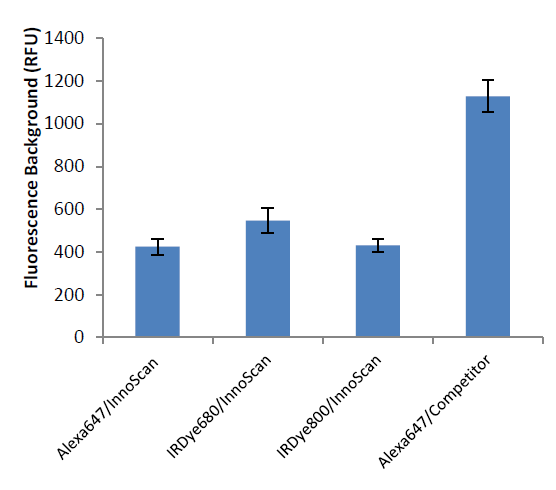
It is important to note that SNR values are also increased with the InnoScan 710-IR scanner when using a visible wavelength fluorophore (Alexa647). The primary contributor to this improvement in sensitivity is the lower background of porous nitrocellulose in the infrared range (Figure 3).
Figure 1: Autofluorescence of porous and non-porous nitrocellulose relative to glass at different excitation wavelengths. Slides were scanned at 532nm and 635nm with a competitor scanner and at 670nm and 785nm with the InnoScan 710-IR scanner. Data is expressed as fold difference relative to glass.
Figure 2: Fold increase in Signal to Noise Ratio relative to detection at 635nm (competi tor scanner). RPPAs were scanned with the InnoScan 710-IR scanner at 670nm for the fluorophores IRDye680 and Alexa647 and at 785nm for the fluorophore IRDye800. RPPAs were scanned at 635nm with the competitor scanner for fluorophore Alexa647.
Discussion
The differences in fluorescence background between the competitor and the InnoScan 710- IR microarray scanners can be explained by two aspects: First scanning in infrared naturally diminishes the background fluorescence (Figure 1). The InnoScan 710-IR microarray scanner features two lasers with excitation wavelengths at 670nm and 785nm. Secondly, the combination of an optimized optical system (wide numerical aperture of the main lens, reduced spectral band of detection, numeric PMT) with a real- time autofocus system gathers a maximum fluorescence coming from the signal of interest while diminishing the background noise. The InnoScan 710-IR scanner provides high quality images and sensitive data thanks to a high resolution of up to 3µm per pixel. This comparison was carried out on RPPAs, however, it can be assumed that all types of protein arrays5 conducted on nitrocellulose slides will see their results improved when scanning using the InnoScan 710-IR microarray scanner. Indeed the background noise is mostly linkedto the nitrocellulose itself and not its associationtoaspecificprobesuchasacell lysate.
Figure 3: Fluorescence assay background. RPPAs were scanned with the InnoScan 710-IR scanner at 670nm for fluorophores IRDye680 and Alexa647 and at 785nm for fluorophore IRDye800. RPPAs were scanned at 635nm with competitor scanner for fluorophore Alexa647. Data are presented as Relative Fluorescence Units (RFU). Parameters were set so that assay fluorescence signals were comparable
Conclusion
Advances in RPPA and more generally protein array technology have resulted in a rapidly growing market. Besides RPPAs there are also analytical and functional protein microarrays. Protein array applications in disease biomarker discovery and validation reflect the enormous potential of protein arrays in the field of personalized medicine.
Until now the rise of protein array technology was limited by high background fluorescence emitted by nitrocellulose. The InnoScan 710-IR infrared microarray scanner now allows an increased Signal to Noise Ratio and thus sensitivity of RPPAs by decreasing background fluorescence. In addition, with a high resolution of up to 3µm per pixel, it allows the acquisition of high quality images.
Literature
1Sevecka M, Wolf-Yadlin A, MacBeath G. (2011) Lysate microarrays enable high-throughput, quantitative investigations of cellular signaling. Mol Cell Proteomics. 10(4):M110.005363
3O’Mahony FC, Nanda J, Laird A, Mullen P, Caldwell H, Overton IM, Eory L, O’Donnell M, Faratian D, Powles T, Harrison DJ, Stewart GD. (2013). The use of reverse phase protein arrays (RPPA) to explore protein expression variation within individual renal cell cancers. J Vis Exp.
4Kingsmore SF. (2006). Multiplexed protein measurement: technologies and applications of protein and antibody arrays. Nat Rev Drug Discov. (4): 310–320. 5Adriana Lagraulet. InnoScan® 710IR Infrared detection for optimal scan of nitrocellulose-based protein arrays. Technical Note INNOPSYS.