To amplify or not to amplify: a comparison between fluorescent detection methods for protein microarray applications. Protein microarrays are the template of choice for many diagnostic applications and proteomic analyses. Reverse Phase Protein Arrays (RPPA) enable the protein content analysis of hundreds of samples in a single assay. Furthermore, picoliter amounts of samples are most often sufficient to provide a significant signal for a given factor. These advantages make RPPA an attractive approach for biomarker evaluation in large patient cohorts. Despite similar functional features with DNA microarrays, a specific substrate composition is essential for protein-based microarrays. Indeed, cellulose nitrate membrane casted on a glass object is most often the substrate of choice for RPPA because of its high protein binding capacity. Since protein expression of a given factor can vary from femto- to micro-molar concentrations, detection sensitivity and dynamic range are two highly critical points to achieve reliable results. Even though signal amplification methods have been successfully used to improve the signal detection levels, it is often accompanied by a narrower dynamic range because of signal saturation by highly expressed proteins. In this work, we demonstrate the influence of the signal detection wavelength in combination with Innopsys dynamic range extension (XDR) detection method on both the sensitivity and dynamic range of the fluorescent signal measured with or without signal amplification on UniSart® Microarrays slides. Whereas the signal amplification reaction seems to be beneficial when measuring at 670nm, it can be circumvented to detect the same protein levels when measuring at 785 nm. Moreover, scanning in a XDR mode allows the use of signal amplification reagents to increase assay sensitivity while keeping 6log dynamic range at 785 nm. Taken together, the choice of fluorophore and scanning method can largely influence the quality and intensity of the measured signals.
Aims: Fluorescent detection methods for protein microarray applications
To compare detection sensitivity and dynamic range between non-amplified and amplified fluorescent signals.
Methods
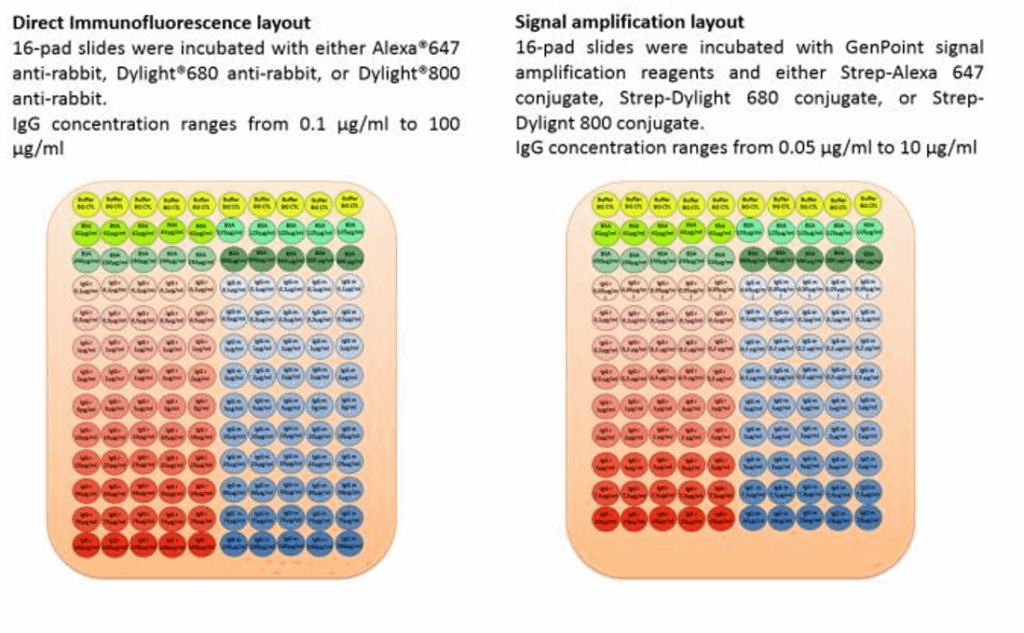
Serial dilutions ranging from either 0.05 to 10 or from 0.1 to 100µg/ml of rabbit and mouse IgG were spotted on nitrocellulose UniSart® Microarray slides (Sartorius Stedim Biotech, Göttingen, Germany; Figure 1). Slides were blocked with Protein Dako® blocker and washed with TBST. After washing, the slides with IgG concentration range from 0.1 to 100 µg/ml were incubated either with Alexa Fluor® 647 Goat Anti- Rabbit IgG (H+L) (Molecular Probes, Germany), Goat DyLight™ 680 Anti-mouse IgG (H+L) or Goat DyLight™ 8OO Anti-rabbit IgG (H+L) (Cell Signaling), for 1 hr at RT° with gentle shaking. After incubation, slides were washed 3 x 5 minutes with TBST and air-dried before scan. Slides with a concentration ranging from 0.05 to 10µg/ml were incubated with Dako GenPoint Tyramide Signal Amplification System (Dako) using either Alexa Fluor® 647-, Dylight 680- or Dylight 800- conjugated streptavidin following vendor instructions.
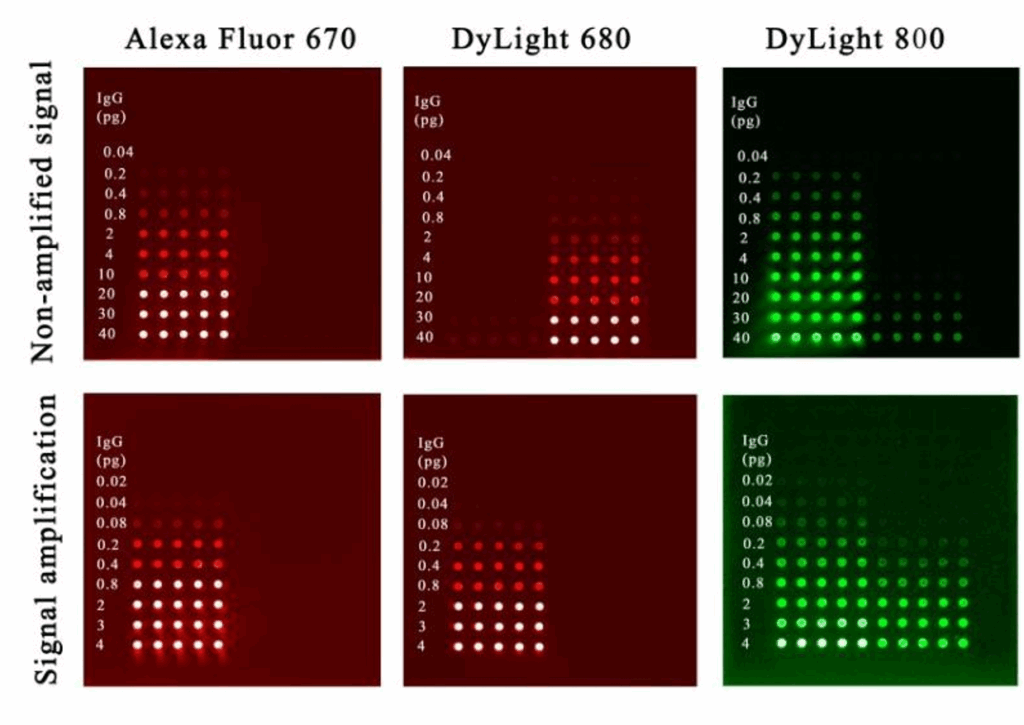
The slides were scanned with the InnoScan® 710-IR microarray scanner (Innopsys, France) under the same scanner settings; the dynamic range extension (XDR) function was used to allow increasing the signal dynamic range detection by creating 20-bit TIFF images (Figure 2). Images were then analysed using Mapix® software (Innopsys, France). Signal to noise ratios were calculated using buffer control spots as background. Concentration data were expressed as absolute protein amounts contained in the spot.
Figure 1. Spotting layout
Figure 2. Representative images: 20-bit images were obtained by scanning in the InnoScan 710-IR scanner at 670 nm and 785 nm excitation wavelengths in a XDR mode. 20-bit images allow for a dynamic range of up to 6log in contrast to 16-bit images in which the dynamic range is limited to 4log.
REsults: Fluorescent detection methods for protein microarray applications
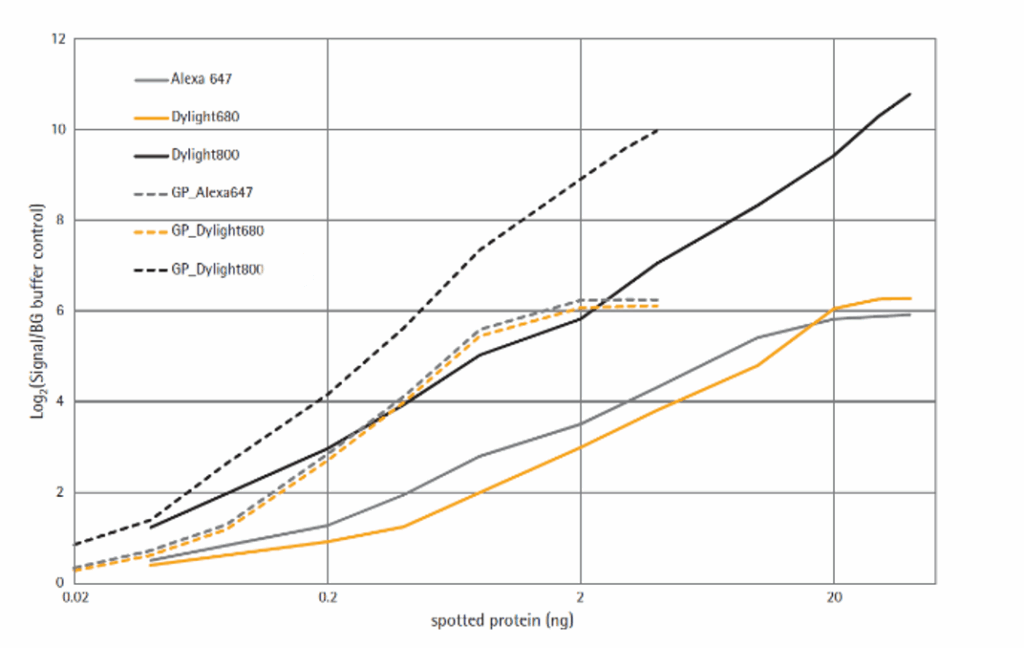
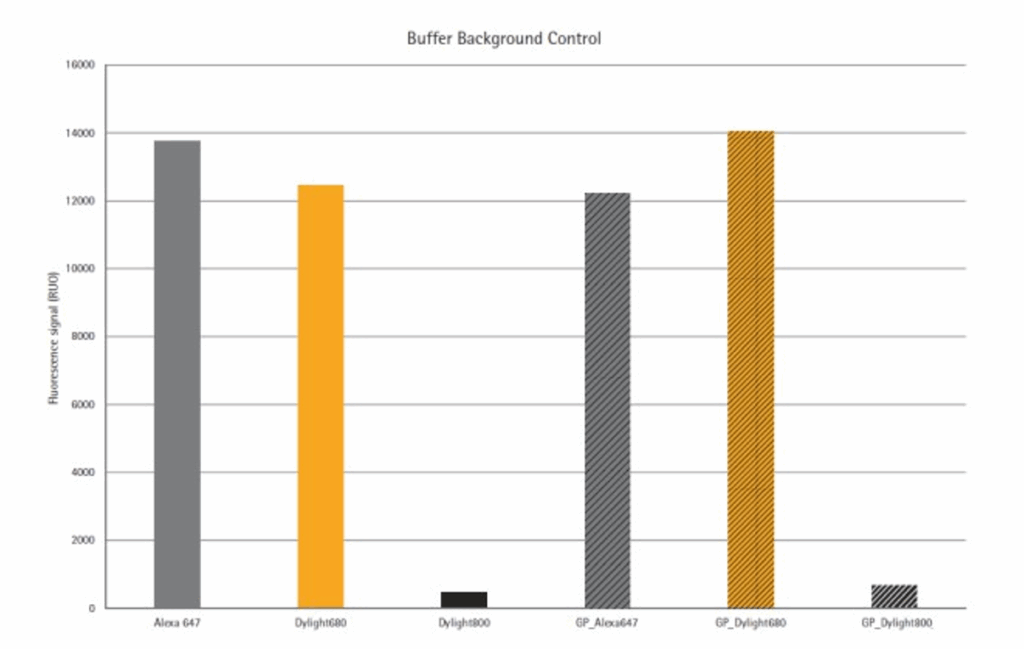
Figure 3 shows the signal to background (S/B) ratios at different detection systems. Fluorescenceintensityiscalculatedforeachspot. Background was defined as the signal measured in those spots with dilution buffer only. Data is expressedinfunctionofabsoluteproteincontent in the spot. Detection in the infrared wavelength at 785 nm were more effective than detection at 670 nm. Direct immunofluorescence at 785 nm show similar S/B ratios as those obtained using signal amplification using either Alexa Fluor 647- or Alexa Fluor 680-streptavidin conjugates. This is explained by the low background levels observed at 785 nm (Figure 4). As expected, signal amplification increases sensitivity atallwavelengths.However,italsodecreasesdynamic rangeandlinearity.Directimmunofluorescenceat785 nm showed good sensitivity while keeping 6log dynamic range.
Figure 3. S/B ratio at different wavelength detection (635 nm for Alexa Fluor® 647; 670 nm for Dylight® 680, and 785 nm for Dylight® 800) and w/o signal amplification: GP prefix refers to Dako GenPoint Tyramide Signal Amplification System.
conclusion
All 3 investigated wavelengths show good practical signal to background ratio on the nitrocellulose substrate. However, the dynamic range extension (XDR) scan mode allows increasing dynamic range to 6logs in which signal saturation levels are stated at 1,048,000 instead of 65,000 of a 16-bit image. Hence the XDR allows to detect protein with widely expression levels in the same image.
Detection mode and wavelength are two critical points to define in a RPPA assay. Whereas the signal amplification reaction seems to be beneficial when measuring on a nitrocellulose substrate at 670 nm, it can be circumvented to detect the same protein levels when measuring at 785 nm.
Figure 4. Background buffer control signals at different wavelength detections, 635, 670 and 785 nm (see Fig 3 for details).