Cécile NAUD (1) I Louisa BOYER (1) I Charline BARABAN (2) I Perrine BOREL (2)
(1) SmartCatch, Toulouse, France
(2) Innopsys, Carbonne, France
Introduction: CTC and CAC Detection using Combined Enrichment, Imaging, and open-source Analysis
Cancer remains a leading cause of mortality worldwide, complicated by tumor heterogeneity and metastatic progression. Liquid biopsy offers a minimally invasive way to access tumor-derived material from biofluids, enabling monitoring of disease and identification of therapeutic targets. Among these biomarkers, circulating tumor cells (CTCs) are particularly valuable as they are intact, viable cancer cells that reflect the phenotypic and molecular characteristics of tumors. CTCs are typically defined as CD45⁻/EpCAM⁺/PanCK⁺ cells; however, EpCAM⁻ subpopulations are increasingly recognized for their biological and clinical relevance, as they may be associated with epithelial-to-mesenchymal transition, metastasis, and therapy resistance [1]. Their extreme rarity in blood requires highly sensitive and specific isolation and detection methods.
SmartCatch has developed X-Tracker®, a technology that captures CTCs and cancer-associated cells (CACs) based on physical properties such as size and deformability, instead of immunological markers. Using micro-engineered filters, X-Tracker® enables gentle isolation while preserving cell morphology for downstream analyses, including immunostaining and molecular profiling.
Although some WBC may also be retained due to size overlapping, optimized staining and imaging allow accurate discrimination.
Innopsys brings over 25 years of expertise in fluorescence slide scanning solutions. The InnoQuant system provides rapid, high-resolution acquisition of quantitative fluorescent images using line-by-line scanning, eliminating the need for tiling and avoiding stitching or shading correction artifacts. Its built-in quality control ensures reproducible results over time, while the 24-slide autoloader enables automated, standardized acquisition of multiple samples.
In this study, SmartCatch and Innopsys jointly explore the combination of X-Tracker® enrichment with InnoQuant fluorescence imaging to generate high-quality, reproducible images suitable for downstream analysis. Current processes require manual review of all datasets using conventional microscopy instruments, raising concerns related to instrument-dependent variability, operator bias, and throughput limitations. To move toward a more automated workflow, we developed a guided open-source software-based pre-classification approach for CTCs and CACs, followed by final review and validation by the pathologist.
Materials & Methods
Samples
Citrate Phosphate Dextrose blood bags from healthy donors are acquired through the Etablissement Français du Sang. PC3 cells, a human prostate adenocarcinoma cell line, are used to mimic cells or interest. Several control samples are prepared : WBC samples (10mL of healthy blood), Cells of interest samples (PC3 cells spiked in 10mL PBS), Model samples (PC3 cells spiked in 10mL of healthy blood), and processed through X-Tracker®. Cancer patient samples are provided by the LBMO (Laboratoire de Biologie Médicale Oncologique) from Oncopole Claudius Regaud as material from the CAPT-CTC clinical trial NCT06904625. Briefly, about 10mL of K2-EDTA blood samples collected from 2 metastatic breast cancer patients are filtered with X-Tracker ®.
X-Tracker® processing
The protocol applied is “Isolation and fixation” with CTC-InSITU consumable. The samples pass through the filters, and captured cells are fixed directly in the machine using Formalin 10% for 20 min for control samples and PFA 3,6% for cancer patient samples.
Immunofluorescent staining
After X-Tracker® processing, the filters are stained directly on a glass slide. Cell permeabilization is performed using Triton X100 followed by saturation with human serum. The antibody mix containing anti-EpCAM-AF488, anti-PanCK C11-AF594 and AE1/AE3-AF594, anti-CD45-AF647, anti-CD16-APC and anti-CD11b-APC is incubated on the samples. Filters are then mounted in mounting media containing Hoechst 33342 and sealed with a coverslip. To simplify the reading of the document, “anti-CD45” refers to the cocktail of anti-CD45, anti-CD16 and anti-CD11b.
Isotypic samples filters are prepared similarly, by replacing specific antibodies by Isotypic antibodies carrying the same fluorophores as the antibodies used in the full staining protocol.
To help the fluorescence background determination in each fluorescence channel, a partial protocol staining is applied to some control samples by removing one of the specific antibodies from the staining mix. As an example, DAPI/PanCK/CD45 staining is used for the background analysis in AF488 / 488nm channel. The same principle is applied for each channel.
Acquisition
Samples are scanned using the InnoQuant slide scanner from Innopsys, using the focus by content automatic focus method. The laser powers are set to 100% for all wavelengths (375/488/561/640 nm) and the corresponding PMT gains are set to 0.4/2/2/1 respectively for each channel. Parameters are saved and reused for all sample types to guarantee the reproducibility and comparability of the results.
Analysis workflow
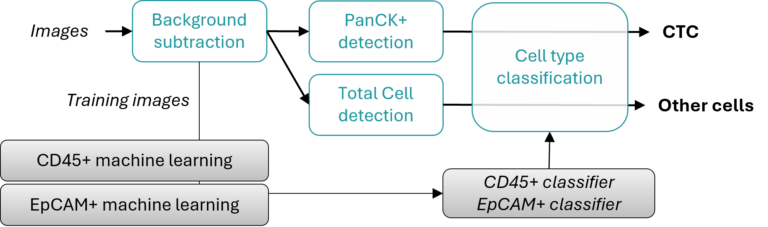
Cells of interest (PC3 for control samples or CTC/CAC for patient samples) are defined as CD45-/[EpCAM and/or PanCK]+ while leukocytes are described as CD45+/EpCAM-/PanCK-.
Background subtraction
Fluorescent background intensity is calculated on Control samples stained with isotopic or partial staining protocol. The Cell Detection feature in QuPath [2] is applied on the DAPI channel with a dilatation to define each cell area. The mean intensity of the 3 channels (EpCAM, PanCK, and CD45) is calculated for each sample, and the higher mean value is chosen as the reference value to be subtracted (2801 for EpCAM channel; 201 for PanCK channel; 411 for CD45 channel). Then, each channel of every sample is normalized in Fiji ImageJ [3] using the Process>Math>Subtract feature.
PanCK detection
The total number of cells is calculated in QuPath using the Cell detection feature on the DAPI channel. Images are duplicated for PanCK detection and the total number of PanCK positive cells is calculated using the Cell detection on the PanCK – 561 nm channel.
Classifier training
To train classifiers for automatic cell classification, training images were created using all control samples. Cells were detected on the DAPI channel to create objects. Every new classifier was trained using the feature Objects classification>Train object classifier. This feature uses machine learning based on a Random Trees algorithm that uses the intensity of the signal for the training (mean intensity in the object, higher and lower intensity value and standard deviation of the intensity in the object). CD45+/- and EpCAM+/- classifiers were merged using the Object classification>Merge object classifiers feature.
Pre-classification
The pipeline was applied sequentially as follows: (1) detection of PanCK-positive cells, (2) subclassification of PanCK+ cells using the merged CD45+/− and EpCAM+/− classifiers, (3) detection of all cells on duplicate images, and (4) application of the classifiers on duplicates.
Results
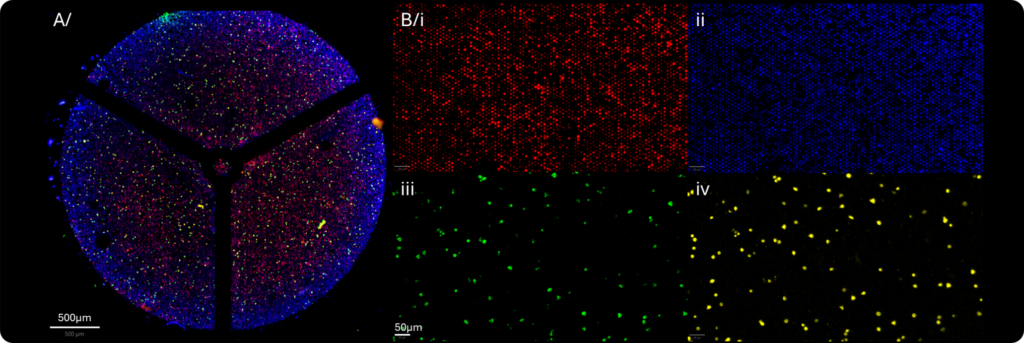
InnoQuant acquisition for CTC cells
InnoQuant is fully compatible with SmartCatch filters and provides spatial resolution enabling reliable discrimination of individual cells without image processing (Figure 2). The image demonstrates uniform quality across the entire filter, with effective compensation for filter flatness variations through the scanner’s autofocus system, obtained in a single field of view in under 4 min. The network of cells trapped into the SmartCatch filter pores is clearly visible, with limited background noise and well-defined labeling.
Analysis workflow on a Model: CTC capture, scan and analysis
The DAPI-based segmentation enables the individual detection of each cell. The workflow was applied to classify the different cellular populations based on their immunostaining, as illustrated on a Model sample in Figure 3A. Cells of interest are circled in pink, whereas WBC are circled in green. In this example, cells were accordingly assigned and counted within each subgroup. The results show consistent cell counts, with a clear predominance of WBC, while the very rare cells of interest represent a minor population (Figure 3B).
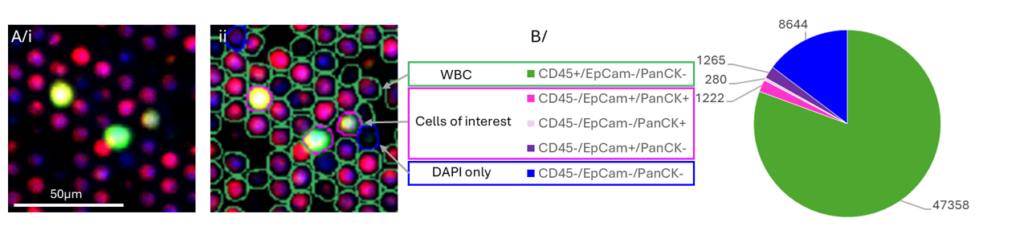
However, around 15% of cells are pre-classified as DAPI positive only in this example, possibly due to limited antibody accessibility, masked epitopes, or weak marker expression. Some cells also remain misclassified due to background signal and autofluorescence from sample-associated elements such as red blood cells, unevenly distributed across the filter. To address these limitations, the workflow was optimized to provide robust pre-classification by limiting the number of candidate cells of interest while ensuring none are missed. These candidates can then be reviewed and validated by qualified staff, according to clinical practices. This review can be performed directly in QuPath, which displays all detected cells in a tabular format integrating corresponding cell images and quantitative features, including per-channel fluorescence intensities, spatial coordinates, cell diameter, and other morphometric parameters.
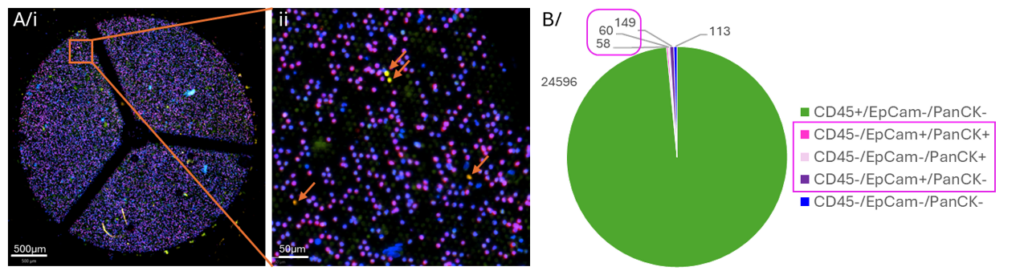
Application to Patient samples: CTC collection with X-Tracker® , scanning with InnoQuant and automated pre-classification
Application to Patient samples
X-Tracker® was used to collect CTCs from patients with metastatic breast cancer, followed by InnoQuant scanning and automated analysis. The workflow demonstrated efficient capture of CTCs (Figure 4), with cell population distributions consistent with biological expectations (CD45+ cells represent the majority, while CTCs and CACs constitute a rare but detectable population (Figure 4B)). As expected, the number of potential CTC candidates exceeds the true count, as the pipeline was intentionally designed to maximize sensitivity. An expert validation step using the QuPath review table ensures accurate final classification. Importantly, the automated pre-classification reduces ~30,000 detected objects to approximately 300 CTC/CAC candidates, enabling rapid review. This approach significantly improves efficiency while remaining fully compatible with standard clinical practice, combining sensitivity, reliability, and scalability for rare cell detection.
Conclusion
This study demonstrates the successful combination of X-Tracker®, InnoQuant, and an image analysis tool for the detection and pre-selection of CTCs/CACs. The workflow shows strong compatibility and complementarity between rare cell capture, imaging, and analysis steps, enabling reliable rare-cell identification on micro-filters. X-Tracker ® captures cells based on physical properties rather than EpCAM marker expression alone, allowing recovery of heterogeneous cancer-associated cell populations. InnoQuant provides fast, reproducible, and quantitative whole-filter imaging using line-by-line scanning, ensuring consistent fluorescence measurements across and between samples. The robustness and homogeneity of the generated datasets improve their suitability for automated image analysis workflows. The workflow we developed enables robust cell detection and effective pre-classification. The number of events requiring manual inspection is significantly reduced, thereby improving downstream validation efficiency and reducing manual review time. For future applications, this approach may provide a foundation for quantitative single-cell analyses beyond cell counting, including fluorescence intensity measurements, comparison of marker expression levels, and assessment of cellular heterogeneity. This combined solution shows strong potential for future translational and clinical-focused developments.
references
[1] Bates, M et al., Circulating tumour cells: The Good, the Bad and the Ugly, BBA-Rev. on Cancer 1878 (2023)
[2] Schindelin, J. et al. Fiji: an open-source platform for biological-image analysis. Nat Methods 9 (2012).
[3] Bankhead, P. et al. QuPath: Open source software for digital pathology image analysis. Sci. Rep. 7, 16878 (2017)