
Mapping amyloid plaques and lysosomal alterations in FAD mouse brain with InnoQuant quantitative whole-section imaging
Charline Baraban*, Perrine Borel* , Skarleth Cardenas² Romero, Gabriel Pagan² , Bruno Benitez²
*Innopsys, 3 allée des Vignes, Carbonne, France.
²B. Benitez Laboratory, Harvard Medical School, Beth Israel Deaconess Medical Center (BIDMC), Boston
Context of the study
Alzheimer’s disease (AD) is a complex and heterogeneous neurodegenerative disorder characterized by progressive neuronal loss and the accumulation of hallmark pathological features, including extracellular amyloid-β (Aβ) plaques. Aβ plaques are considered an early and central event in disease progression, reflecting an imbalance between Aβ production, aggregation, and clearance. However, beyond their presence alone, the spatial organization and molecular context of Aβ deposition provide critical insights into disease mechanisms.
Recent advances in genetics and neuropathology highlight the endo-lysosomal pathway (ELP) as a key contributor to AD pathogenesis. This pathway plays a central role in neuronal proteostasis, regulating protein trafficking, degradation, and recycling. Disruption of these processes alters amyloid precursor protein (APP) processing promoting Aβ accumulation. In parallel, defects in autophagy and lysosomal function impair the clearance of aggregated proteins, accelerating plaque formation and neurodegeneration.
In this context, studying the colocalization of Aβ plaques with cellular and molecular markers has emerged as a powerful approach to better understand AD biology. Multiplex immunofluorescence (mIF) combined with whole-slide quantitative analysis enables the simultaneous visualization of Aβ plaques and markers of endo-lysosomal degradation, helping to bridge molecular alterations with their spatial manifestations in mouse brain tissue. By revealing where and how Aβ plaques form and interact with disrupted cellular pathways, this approach provides critical insight into disease progression and may support the identification of novel therapeutic strategies targeting early pathogenic events in AD.
Methods
Sample Description
Five 5xFAD mice (JAX #034848), a well-established model of amyloid pathology, were used in this study and compared to 5 Wild type (WT) mice. The FAD mouse model rapidly develops Aβ deposition, neuroinflammation, and cognitive deficits, making it a valuable system for studying AD-related mechanisms.
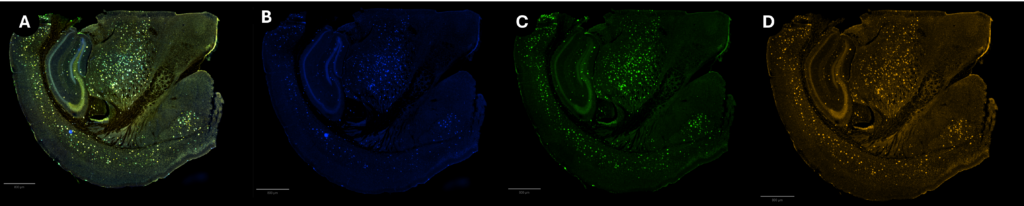
Coronal sections (40 mm) were used for histological analysis. Amyloid plaque burden was assessed using the fluorescent dye X-34. Co-immunostaining was performed with the 82E1 antibody to detect Aβ and Lamp1 to evaluate lysosomal dysfunction.
Fluorescence channels were assigned as follows: X-34 in the blue channel (375 nm); 82E1 in the green channel (488 nm); and Lamp1 in the red channel (561 nm). This multiplex staining strategy enables simultaneous visualization of Ab deposition and lysosomal dysfunction within the same tissue sections.
Data Acquisition
Samples were scanned using the InnoQuant slide scanner, equipped with 375 nm, 488 nm, and 561 nm lasers, set respectively to [100%, 100%, 100%, power]. Emission signals were collected simultaneously on four dedicated photomultiplier tubes. PMT gains were set to 2%, 2%, and 8% for the 375, 488, and 561 channels, respectively, with acquisition parameters adjusted to avoid image saturation. Focus-by-content autofocus was performed on the 375 nm reference channel.
The resulting unmixed whole-slide image streamlines digital analysis without tile stitching or shading correction, and was automatically saved as a 16-bit pyramidal OME-TIFF for downstream quantification.
Analysis pipeline
The workflow was implemented in Groovy in QuPath v0.6.0 using a StarDist model. Brain regions were manually annotated prior to automated analysis. X34, 82E1 and Lamp1 objects were detected using StarDist and filtered based on size, circularity and intensity criteria (including mean and max intensity thresholds, marker specific).
Colocalization between markers was defined by an overlap ≥5% of the smaller object area, generating new classes (X34+82E1 and 82E1+Lamp1). Measurements were extracted for all object classes.
In parallel, global colocalization coefficients (Pearson and Manders M1 and M2) were computed per brain region, with pixel ratio used for validation, as follow.

Xi= intensity of the pixel i in the X canal, Yi= intensity of the pixel i in the Y canal, = mean intensity of the pixels in the X canal, = mean intensity of the pixels in the Y canal

Results
Detection of the plaques
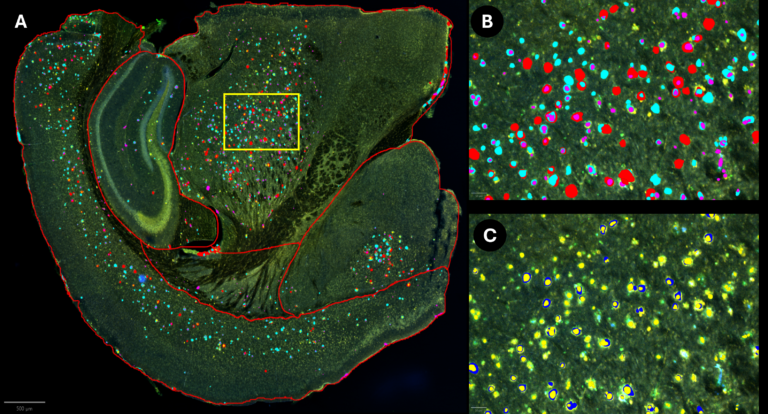
Density of plaques
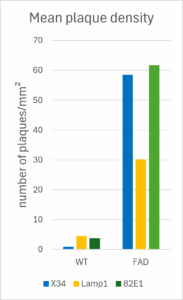
The density of plaques in mm² for 5xFAD and WT samples is represented in Figure3.
The 5xFAD model has a density of plaques 6 to 12 times higher than the WT (on the full brain surface). Although automated detection may occasionally include nonspecific objects, the strong difference between 5xFAD and WT samples, together with visual quality control, supports the robustness of the plaque detection and indicates that the quantified signal mainly reflects true plaque burden.
Colocalization of the X34 and 82E1 plaques
X-34 selectively binds β-sheet-rich fibrillar aggregates, while 82E1 recognizes the N-terminus of Aβ, including monomeric and aggregated forms. The X-34 and 82E1 marker combination was considered to characterise the molecular nature of amyloid deposits.
Percentage of colocalisation
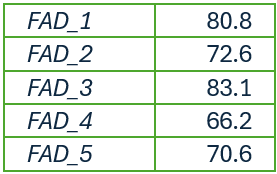
This colocalization evaluation is object-based. [4] To calculate this value, the pipeline uses the detected objects and checks that both object overlap (overlap ≥5% of the smaller object area). It was calculated as follows.
As seen in Table1, a majority of the X34 plaques is in contact with the 82E1 plaques, suggesting a strong spatial overlap. It confirms that the observed X-34-positive structures correspond to valid Aβ plaques.

Coefficient’s analysis
Pearson and Manders (M1 and M2) coefficients are based on pixel intensity rather than object geometry. They provide a complementary and robust measure of signal colocalization, but should be interpreted together with the spatial colocalization analysis performed previously.
Pearson coefficient designates a pixel-by-pixel correlation between the fluorescence intensities of two channels.
Manders coefficients go further than just the geometric colocalization percentage calculated previously. M1 designates the fraction of X34 signal overlapping with 82E1 signal and M2 designates the fraction of 82E1 signal overlapping with X34 signal.
It is particularly informative when plaques areas are different between markers. For example, if a small X-34 positive signal is contained within a bigger 82E1 positive plaque, then the M1 number will be close to 1 while the M2 number will be lower.
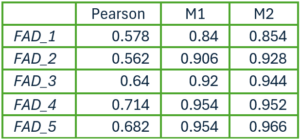
In Table2, Pearson’s correlation coefficients ranged from 0.58 to 0.71. This suggests that regions with increased X-34 signal tend to coincide with regions of higher 82E1 signal. In addition, the high Manders coefficients (M1 and M2 > 0.84) demonstrate that a large proportion of both fluorescence signals overlap, supporting a strong degree of colocalization between X-34 and 82E1.
Together, the geometric and intensity-based analysis confirm the strong association of X34 and 82E1 signals, validating that the observed X-34-positive structures correspond to valid Aβ plaques.
Colocalization of the 82E1 and Lamp1 signals
Lamp1 labels late endosomes and lysosomes, while 82E1 specifically recognizes the N-terminus of Aβ. The spatial overlap of these markers indicates the accumulation of lysosomes at Aβ-rich sites in the tissue, supporting the association between amyloid deposition and lysosomal dysfunction.
Percentage of colocalization

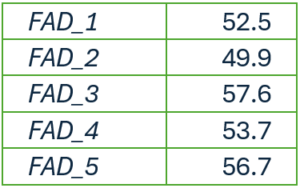
As seen in Table3, around a half of the LAMP-1 positive signal is in contact with the 82E-positive plaques.
Given that lysosomal compartments are typically distributed around amyloid deposits rather than within the plaque core, [5] this degree of association supports a robust plaque-associated lysosomal response. These findings suggest that Aβ plaque accumulation is accompanied by local lysosomal enrichment.
Coefficient's analysis
In Table4, Pearson’s correlation coefficients were around 0.77, indicating a strong pixel-by-pixel correlation between 82E1 and LAMP1 fluorescence signals. This suggests that regions enriched in Aβ signal tend to coincide with regions showing increased LAMP1 signal.
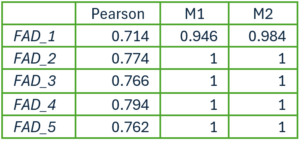
In addition, the high Manders coefficients with M1 and M2 values close to 1, indicate that nearly all above-threshold signal from each channel spatially overlaps with the other. Such high values may raise the presence of technical bias (background, spectral bleeding…) that have been carefully considered. However, InnoQuant’s optical pathway has been designed to avoid crosstalk, with a spatially demultiplexed excitation combined with dedicated PMTs for each excitation wavelength. Moreover, the consistency between high Manders coefficients and a strong Pearson’s coefficient supports the robustness of the observed association.
Both geometric signal intensity-based colocalization support a strong spatial association between LAMP-1 signal and 82E1-positive Aβ plaques. These results suggest that Aβ plaques are associated with local lysosomal enrichment, consistent with plaque associated endolysosomal alterations.
Discussion
Our findings provide further evidence supporting a close relationship between amyloid pathology and lysosomal dysfunction, a phenomenon increasingly recognized as hallmark of neurodegenerative disease progression.
First, the strong colocalization between X-34 and the N-terminal Aβ antibody 82E1 validates the robustness of our plaque detection strategy. The concordance between the structural labelling provided by X-34 and the molecular specificity of 82E1 confirms that both markers reliably identify amyloid plaques, providing confidence in the subsequent colocalization analysis.
We also observed significant colocalization between 82E1 and LAMP1, indicating that lysosomes accumulate in the vicinity of Aβ plaques. This finding is consistent with previous studies demonstrating that the microenvironment surrounding amyloid deposits is enriched in dystrophic neurites and enlarged lysosomal compartments, reflecting impaired lysosomal trafficking and degradative function.
Importantly, we found a strong association between amyloid plaque burden and lysosomal accumulation in the 5xFAD mouse model. Compared with WT animals, 5xFAD mice exhibited both increased amyloid deposition and a marked increase in LAMP1 immunoreactivity surrounding plaques. These findings suggest that lysosomal alterations are closely linked to the development and progression of Aβ pathology. Several mechanisms may underlie this relationship. Lysosomes may reflect a cellular response to sites of amyloid deposition as an attempt to clear toxic Aβ aggregates, but persistent amyloid accumulation could overwhelm the lysosomal system, leading to impaired degradative capacity. Alternatively, lysosomal dysfunction may precede plaque formation and contribute to Aβ accumulation by reducing amyloid clearance. Together, these findings support a close interplay between lysosomal dysfunction and amyloid pathology during disease progression.
Conclusion
In conclusion, this study provides imaging-based evidence of spatial correlation between amyloid plaques and lysosomal accumulation, with a strong association observed in 5xFAD models. These findings support the concept that amyloid plaque pathology and lysosomal dysfunction are closely linked in Alzheimer’s disease models. From a translational perspective, our results further highlight the endolysosomal system as a potential therapeutic target for modifying disease progression.
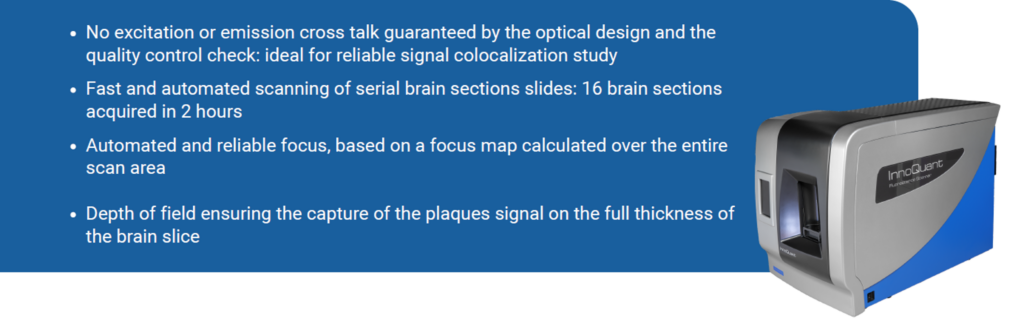
Why is InnoQuant ideally suited for rigorous colocalization studies?
references
[1] Bankhead, P. et al. (2017) QuPath: Open source software for digital pathology image analysis. Scientific Reports. https://doi.org/10.1038/s41598-017-17204-5
[2]Uwe Schmidt, Martin Weigert, Coleman Broaddus, and Gene Myers. Cell Detection with Star-convex Polygons. International Conference on Medical Image Computing and Computer-Assisted Intervention (MICCAI), Granada, Spain, September 2018.
[3]McMaster Biophotonics Facility. (s.d.). Colocalization guide. McMaster University. https://www.science.mcmaster.ca/biophotonics/
[4]Lunde, A., & Glover, J. C. (2020). A versatile toolbox for semi-automatic cell-by-cell object-based colocalization analysis. Scientific Reports, 10. https://doi.org/10.1038/s41598-020-75835-7
[5] Gowrishankar S. et al. Massive accumulation of luminal protease-deficient axonal lysosomes at Alzheimer’s disease amyloid plaques. PNAS, 2015.