Introduction: Tumor microenvironment analysis in NSCLC
In the field of cancer research, many advancements have been made over the last decade through studies of the tumor microenvironment. Tumor sample tissues are characterised by a significant spatial heterogeneity associated with biological complexity. Multiplexed immunofluorescence (IF) staining plays a crucial role allowing simultaneous visualization of multiple biomarkers to identify cell types, understand biological pathways and map complex cellular interactions within the tumor microenvironment.
Although several technologies have emerged in recent years, researchers and clinicians working in biomarker discovery and diagnostic areas still face some bottlenecks: 1) the use of tissue microarrays techniques can be limited by tumor heterogeneity and 2) newer high-plex spatial biology technologies can be cost-prohibitive.
Innopsys has developed InnoQuant, a fluorescence whole-slide scanner with a unique optical-design optimized to facilitate high content data generation and analysis.
Non-small cell lung cancer (NSCLC) tumor microenvironment analysis
Non–small cell lung cancer (NSCLC) accounts for approximately 85% of all lung cancers. Use of therapeutic agents targeted to specific molecular features of the tumor has become standard practice. Therefore, investigating tumor tissue samples to characterize the presence of immune cells and immune checkpoints is helpful to target the appropriate therapy for individual patient treatment.
Multiplex immunohistochemistry (mIHC) enables simultaneous staining of multiple immune markers on a single tissue section.
The following immuneprofiling panel was used to study immune infiltration in cancer tissue: – PD-L1 is an immune checkpoint marker, shown to be expressed on myeloid cells and proposed as potential target in cancer immunotherapy. PD-L1 is also expressed on tumor cells – Granzyme B (GrB) is one of the serine protease granzymes most found in the granules of natural killer cells (NK cells) and cytotoxic T cells – CD8 is a marker for cytotoxic T-cells
This panel was applied to NSCLC using Cell Signaling Technology mIHC antibodies conjugated with fluorescent dyes as follows: FITC PD-L1, AF594 CD8, Cy5 GrB.
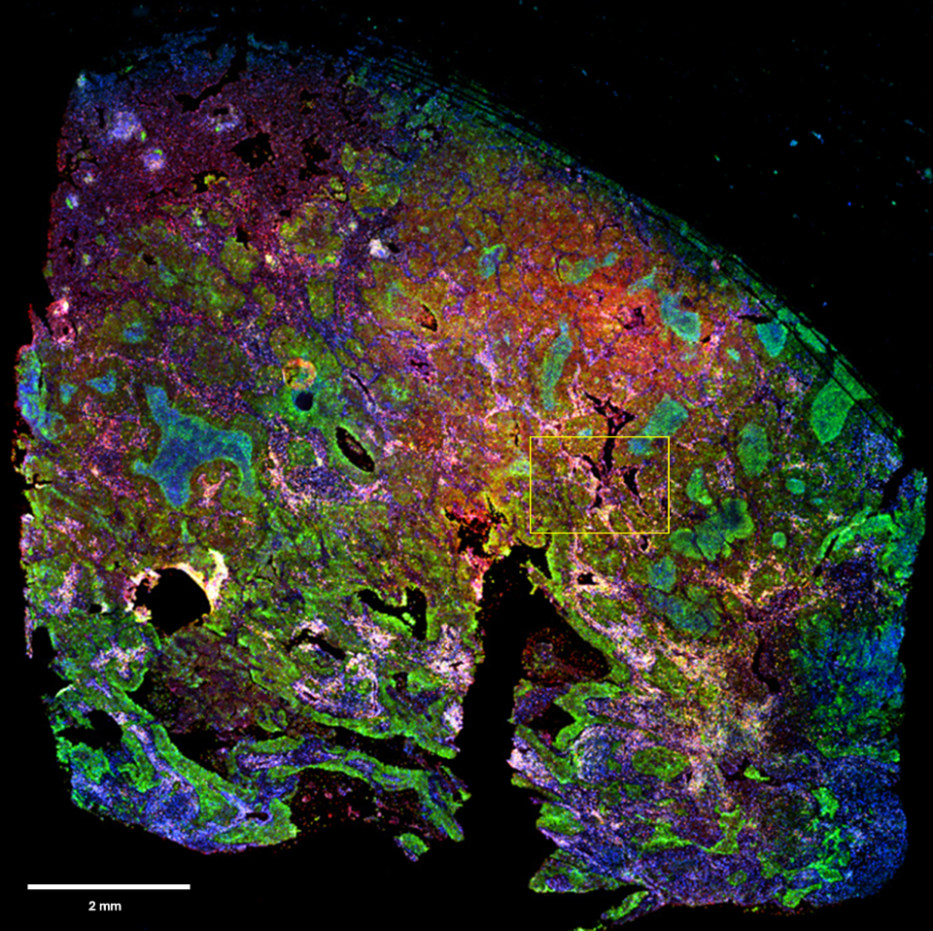
Figure 1: Full image of NSCLC tissue section stained with mIHC and scanned with InnoQuant. ROI for subsequent analysis is highlighted in yellow. Cryosection thickness: 5 µm. Cryosection total area: 97 mm². 4 fluorescence channels scan time: 10 minutes. ROI area: 2 mm². mIHC staining pattern showing in blue nuclei (DAPI), in green PD-L1 (FITC), in yellow CD8 (AF594) and in red GranzymeB (Cy5)
NK cells are identified through the expression of the granzyme B marker labeled with Cy5, depicted in cyan hereafter. Cy5 signal was generated with a 640 nm excitation wavelength, and its emission was collected with a 680/42 BP filter.
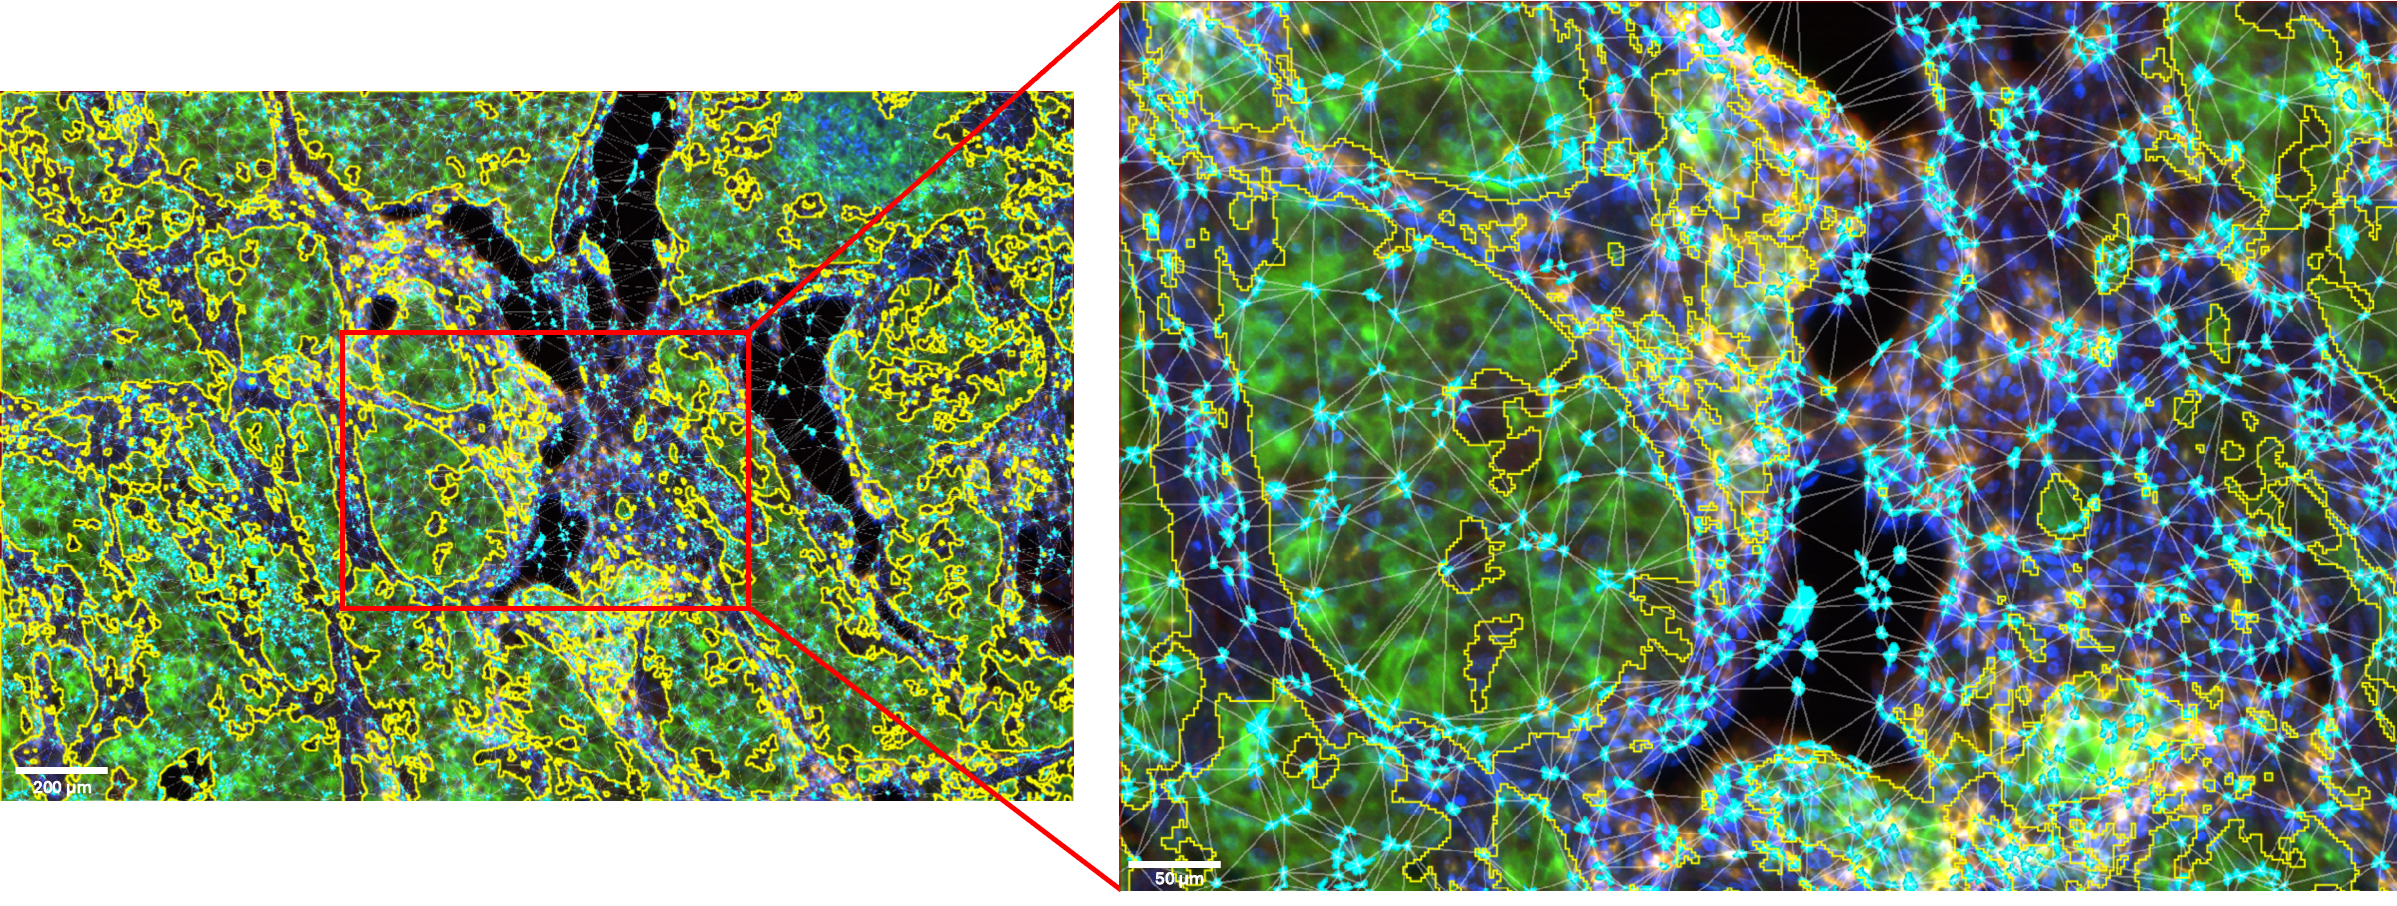
QuPath was used as the image analysis software. The tumor areas were detected by pixel intensity with a threshold of 2200. The NK cells were segmented using deep learning. Clusters of NK cells were identified using the Delauney clusters features 2D, with a distance threshold set to 100 µm.
Figure 2: ROI and details of the NK cells clusters located in the microenvironment of the tumor cells area.
Tumor cells area is outlined in yellow. NK cells are displayed in cyan. Image acquired with InnoQuant. Analysis performed with QuPath.
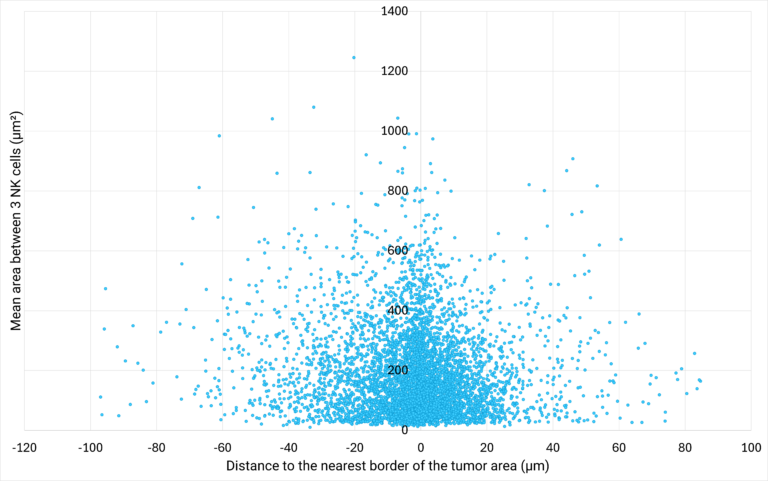
Figure 3: NK cells density plotted against their proximity to the tumor cells are
The area between 3 NK cells (µm²) is defined as the area of the triangle bounded by 3 neighbor cells.
The distance to the nearest border of the tumor area (µm) represents the distance between the centroid of a NK cell to the nearest border of the tumor cells area. If the distance is positive, the NK cell is located outside of the tumor cells area. If the distance is negative, the NK cell is located inside the tumor cells area.
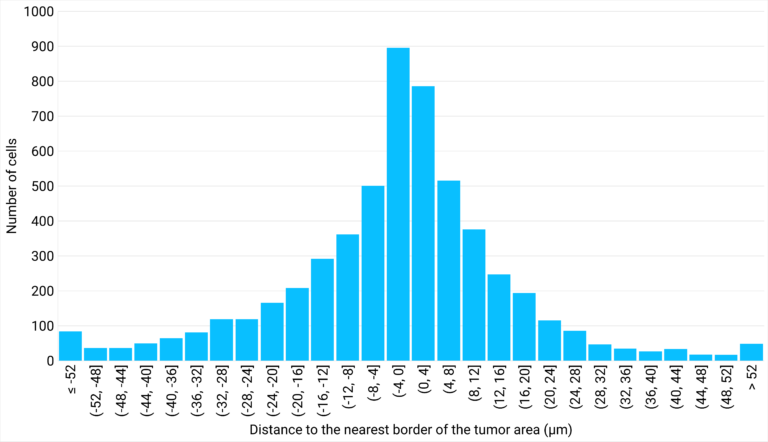
Figure 4: Number of cells distributed close to the tumor cells area, classified in different distance ranges.
The analysis of the area between 3 neighbor NK cells at various distances from the tumor cells area shows that the closer the cells are to the tumor, the greater their density. This suggests that NK cells are more likely to create clusters close to the tumor area. Interestingly, the analysis of the distribution of NK cells at varying distances from the edge of the tumor reveals that a density gradient forms on either side of the edge of the tumor area, with most NK cells located within 12 µm of the tumor zone.
Characterisation of CD8+ T cells clusters - Tumor microenvironment analysis NSCLC
T cells are identified through the expression of the CD8 marker labeled with AF594, depicted in magenta hereafter. AF594 signal was generated with a 561 nm excitation wavelength, its emission was collected with a 593/40 BP filter.
QuPath was used as the image analysis software. The tumor areas were detected by pixel intensity with a threshold of 2200. The CD8+ T cells were segmented using deep learning. Clusters of CD8+ T cells were identified using the Delauney clusters features 2D, with a distance threshold set to 100 µm.
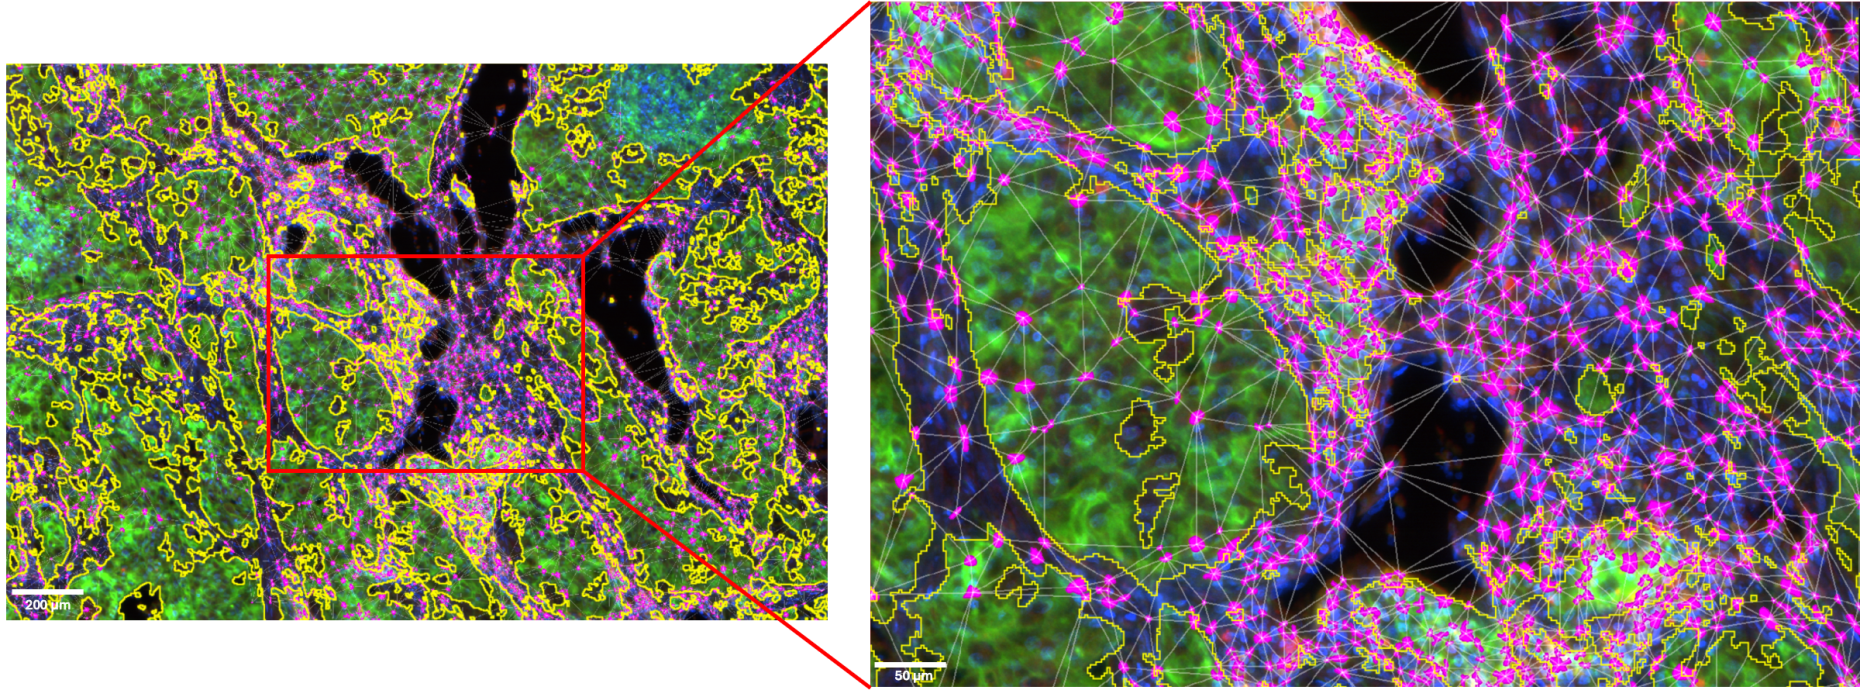
Figure 5: ROI and details of the CD8+ T cells clusters located in the tumor microenvironment.
Tumor cells area is outlined in yellow. CD8+ T cells are displayed in magenta. Image acquired with InnoQuant. Analysis performed with QuPath.
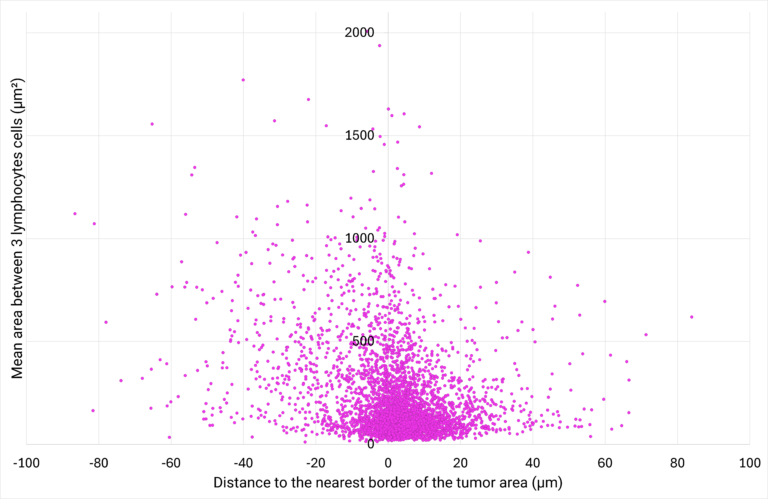
Figure 6: CD8+ T cells density plotted against their proximity to the tumor cells area.
The area between 3 CD8+ T cells (µm²) is defined as the area of the triangle bounded by 3 neighbor cells.
The distance to the nearest border of the tumor area (µm) represents the distance between the centroid of a CD8+ T cell to the nearest border of the tumor cells area. If the distance is positive, the CD8+ T cell is located outside of the tumor cells area. If the distance is negative, the CD8+ T cell is located inside the tumor cells area.
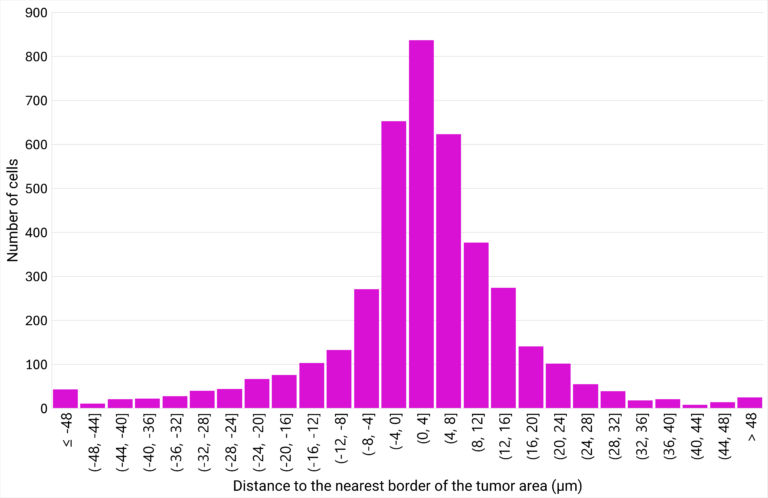
Figure 7: Number of cells distributed close to the tumor cells area, classified in different distance ranges.
The analysis of the area between 3 neighbor CD8+ T cells at various distances from the tumor cells area shows that the closer the cells are to the tumor, the greater their density. This suggests that CD8+ T cells are more likely to create clusters close to the tumor area. Interestingly, the analysis of the distribution of the CD8+ T cells at varying distances from the edge of the tumor reveals that a density gradient forms on either side of the edge of the tumor area, with most CD8+ T cells located within 12 µm of the tumor zone.
The NK cells and the CD8+ T cells seem to both have the same behavior towards the cancer cells. This in-depth study based on whole-slide imaging with InnoQuant helps to understand the distribution of immune cells in a NSCLC tissue sample, resulting in a better characterization of the tumor microenvironment.
The identification of different immune cell-type clusters and the analysis of their proximity to the nearest border of tumor cells area have been carried out using whole tissue images combined with image analysis protocol using deep learning tools.
In this case-study, we demonstrate that whole-slide images from InnoQuant enables the generation of relevant data in a third-part analysis software. The image quality allows measurements such as cell counting and proximity analysis to better understand a patient’s specific pathophysiology. These spatial and quantitative data might be used for further prediction of therapeutic response in the field of immuno-oncology.